PRDEWPOINTCurveXL2016
PRDewPointCurveXL2016
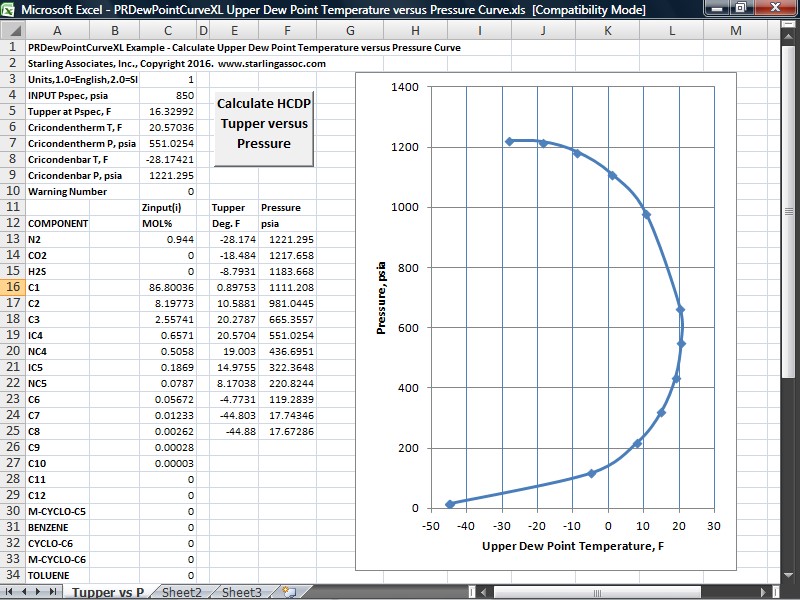
Starling Associates Inc. (SAI) is pleased to announce the introduction of PRDewPointCurveXL2016. Using the natural gas composition, PRDewPointCurveXL2016 calculates the natural gas hydrocarbon dew point (HCDP) curve in a Microsoft Excel spreadsheet. Either English units or SI units can be used. PRDewPointCurveXL2016 outputs a table of the HCDP Tupper versus Pressure. Tupper is the highest temperature at a given pressure at which liquid starts to condense from the natural gas which has the input composition.
PRDewPointCurveXL2016 also calculates the upper dew point temperature, Tupper at a user specified input pressure, Pspec. Pspec could be an expected operating condition, such as a natural gas pipeline operating pressure or the inlet pressure to a natural gas compressor or gas turbine.
Additional outputs are the cricondentherm and cricondenbar temperature-pressure conditions. The cricondentherm temperature is the maximum temperature of the two phase vapor plus liquid region and therefore the input natural gas composition is single phase gas at all pressures for temperatures above the cricondentherm temperature. The cricondenbar pressure is the maximum pressure of the two phase vapor plus liquid region and therefore the input natural gas composition is single phase at all temperatures for pressures above the cricondenbar pressure.
A plot of the upper dew point temperature, Tupper, versus pressure can be added to the PRDewPointCurveXL2016 spreadsheet using Microsoft Excel taskbar tools.

PRDewPointCurveXL2016 Example
HISTORY OF PRDewPointCurveXL2016
The suggestion to provide gas measurement calculations in a spreadsheet format was made in 1992 by John Stuart of Pacific Gas and Electric in a meeting with Ken Starling, Starling Associates Inc. (SAI) founder. Previous SAI products meeting these needs were GOFXL, GOFXL2002, and GOFXL2008, the predecessors to GOFXL2015. In 2015, Rick Kroeker of Enable Midstream Partners added SAI natural gas hydrocarbon dew point software calculations to SAI GOFXL2015 spreadsheets. PRDewPointCurveXL2016 was developed for this application. Of course, PRDewPointCurveXL2016 can be used not only in gas measurement, but also in numerous other natural gas industry applications.
Click here for More Information on Software Trial or Licensing
